Grid Dashboard
Handcrafting Juspay's AI infrastructure control plane
Role
Design + Frontend Code + Visual System
Stack
React · TypeScript · Vite · Blend Design System
I designed and built Grid Dashboard the same way this photo looks: a row of coding agents running on one monitor, the design open on the other, and no real handoff between the two. Same person deciding what a screen should say and then writing the frontend that says it. This is the short version of what got made, and why.
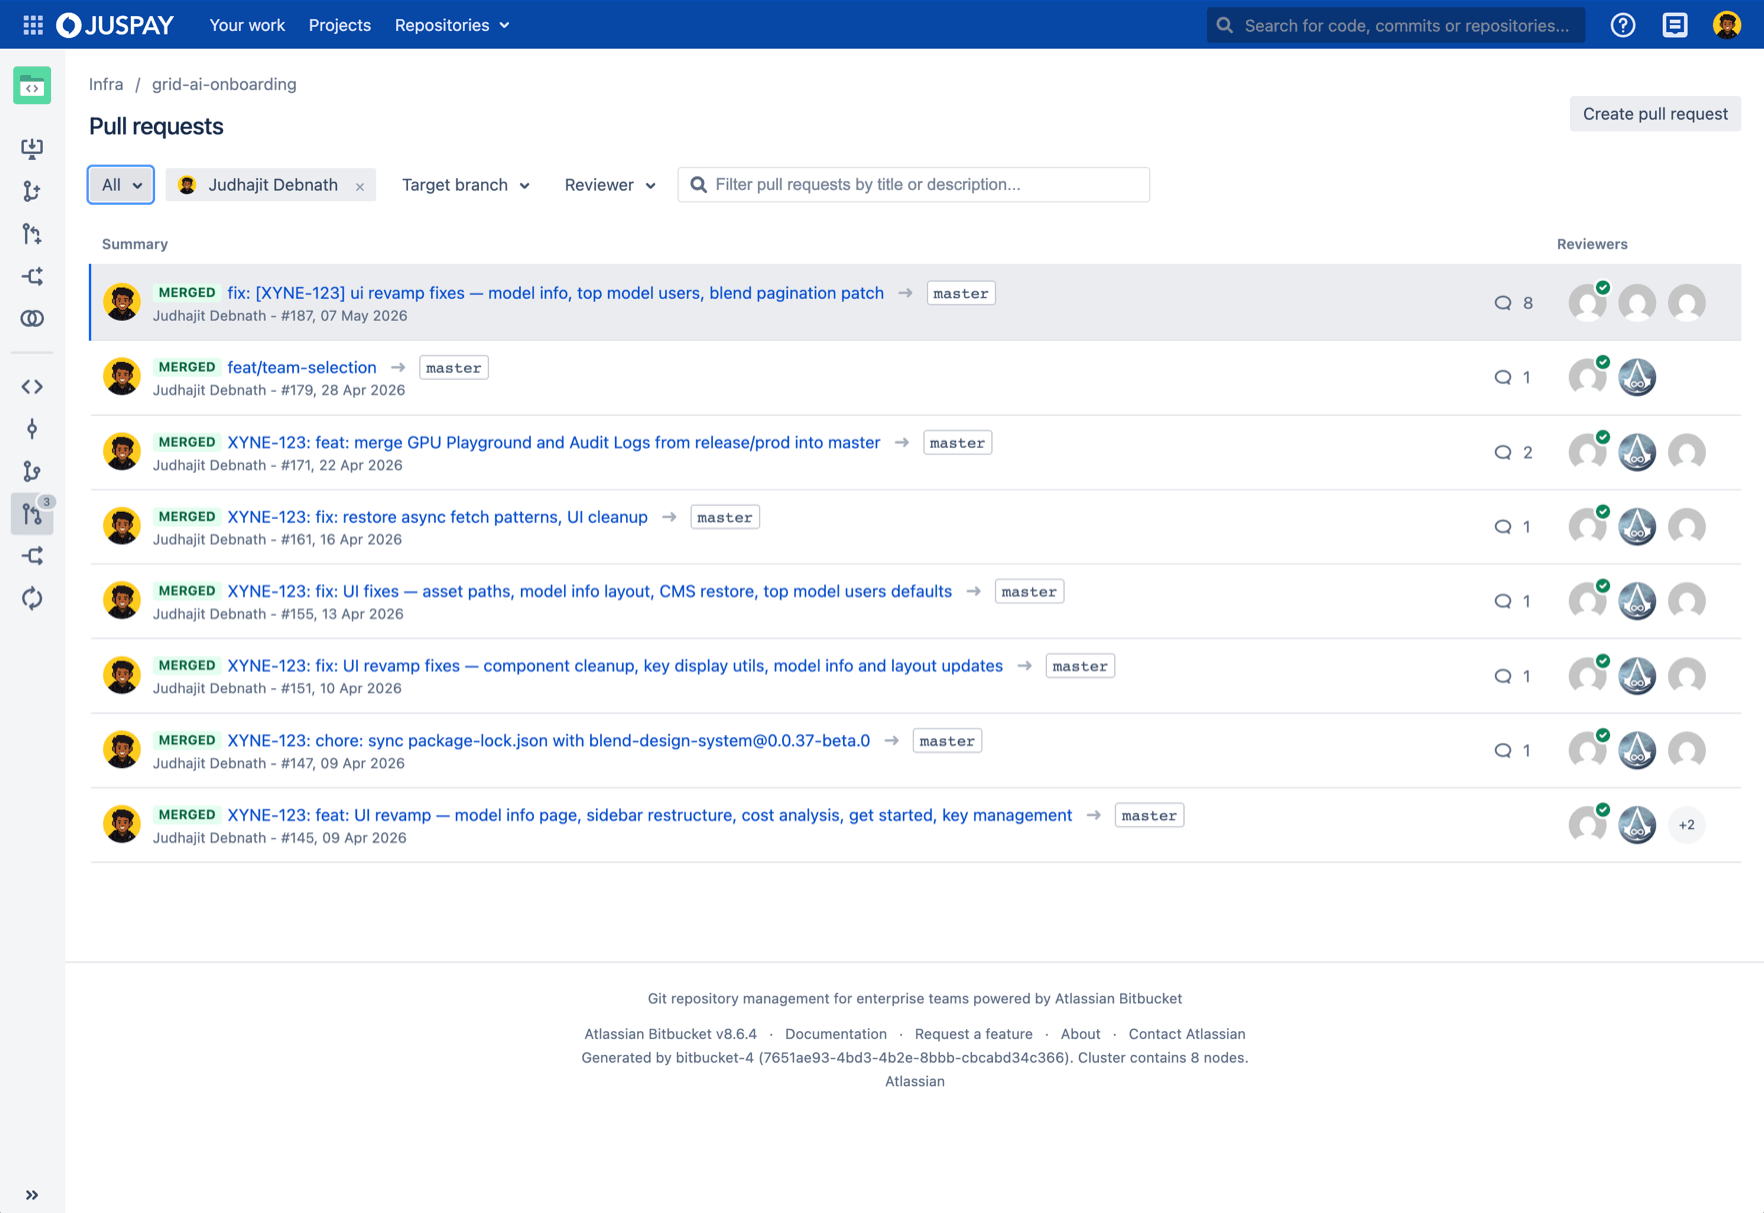
The problem? A platform running blind
Juspay runs a serious chunk of its AI workloads on self-hosted GPU infrastructure - models like Kimi, GLM, and Minimax sitting on expensive hardware that costs money every hour, whether or not anyone's actually using it.
The team already had LiteLLM in front of all of it: an open-source AI gateway that puts one OpenAI-shaped endpoint over 100+ models and handles the platform plumbing - virtual keys, per-team budgets, spend tracking, an admin UI. 682 keys, 510+ engineers a day, every call routed through one door. It handled routing beautifully.
What it couldn't tell you was everything that came next. Are the GPUs being used right now, or burning money idle? Which team is eating the most budget? Why is the cost-analysis number different from what GCP billing says?
Those were the questions my team actually kept asking, and none of them were the gateway's job.
Grid Dashboard was Juspay's answer.
Where the gateway stopped. The gap
A gateway sees requests. It tracks spend per key beautifully. But our spend didn't live in one place - it was split across Vertex AI, self-hosted GPU models, and SaaS plans like Claude Pro, each billing in a different shape. LiteLLM could tell you a key cost money; it couldn't reconcile three billing worlds into one honest number.
And it knew nothing about the hardware underneath a self-hosted model. GPU utilization, off-peak idle, hours burned versus hours wasted, model health when something quietly fell over - all invisible.
The people questioning whether the numbers were even right had a point, because no view actually tied the infrastructure to the cost.
So we built Grid on top of it
Grid keeps LiteLLM as the gateway and turns its request logs into an actual control plane. Two audiences, two completely different jobs, one dataset.
For everyone else, "the non-admin experience."
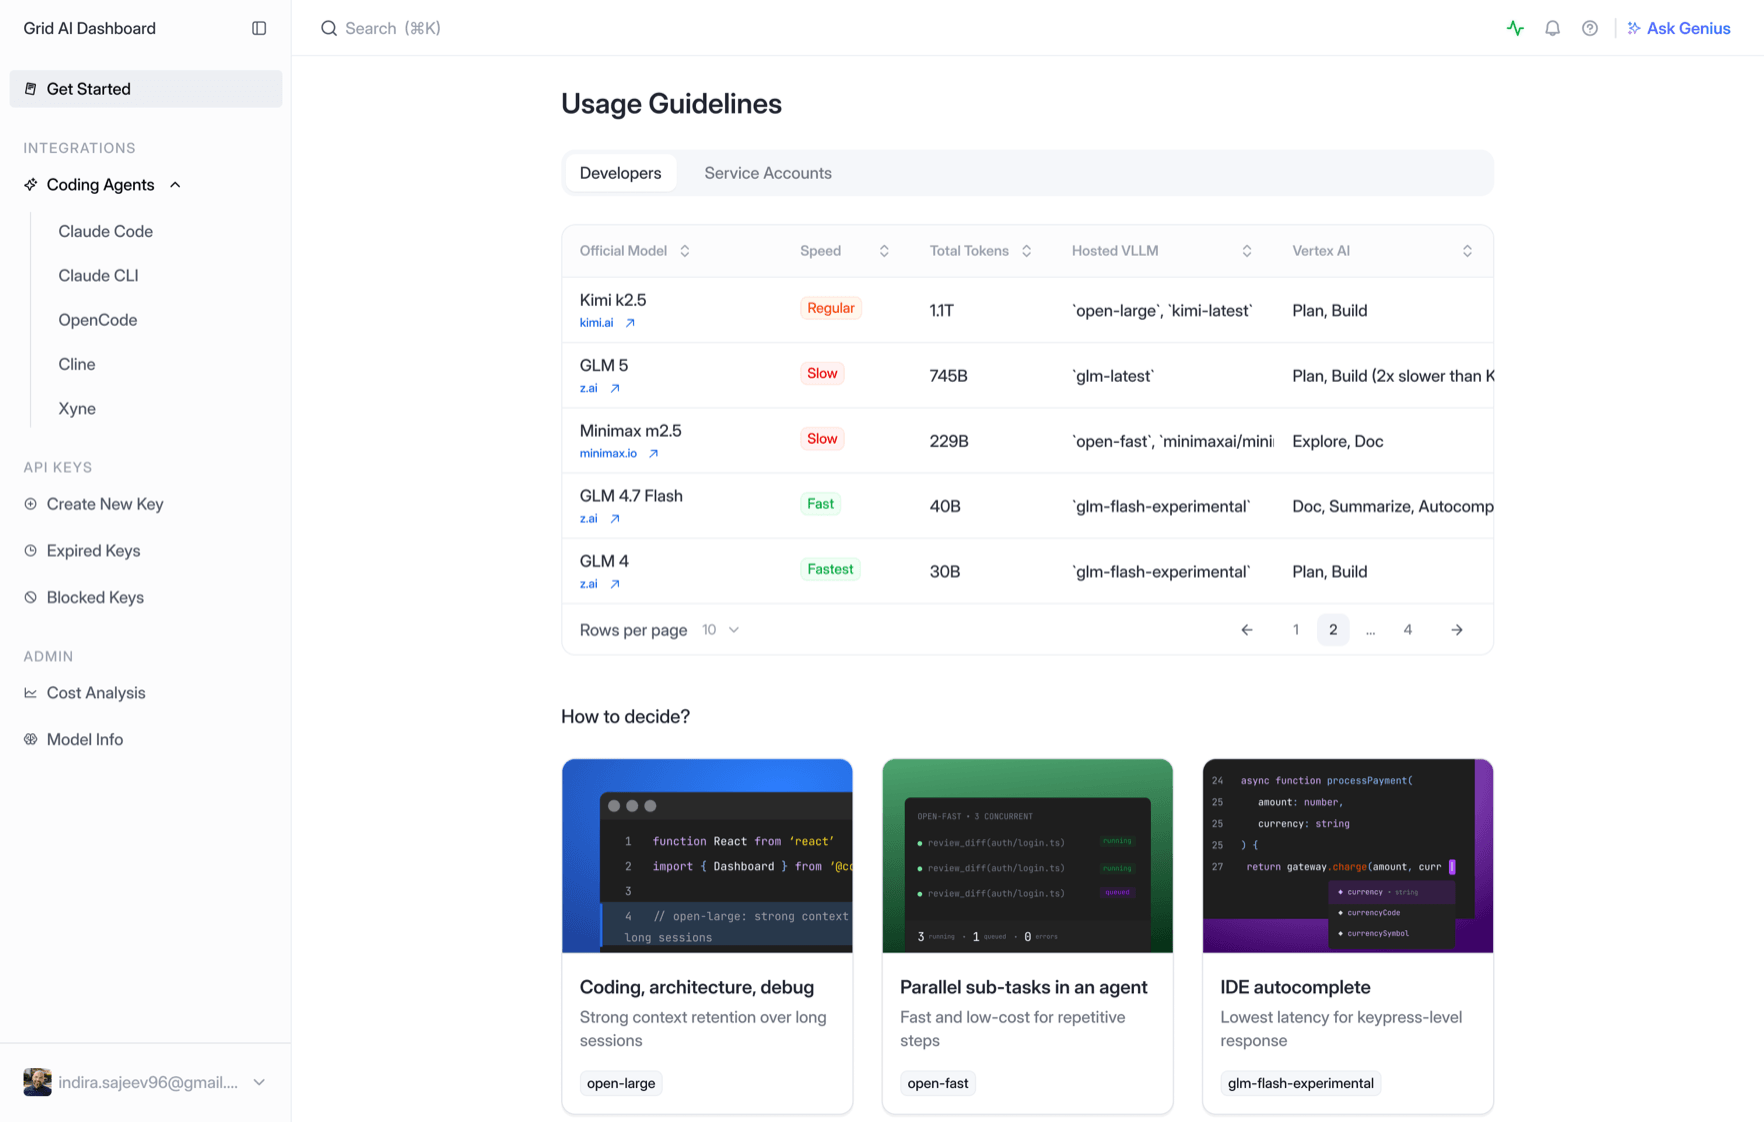
Most of those 500 engineers don't want a cost cockpit; they want to ship. So they get a clean path: onboarding, their own keys, model discovery, and their personal usage - and none of the admin machinery they'd never touch.
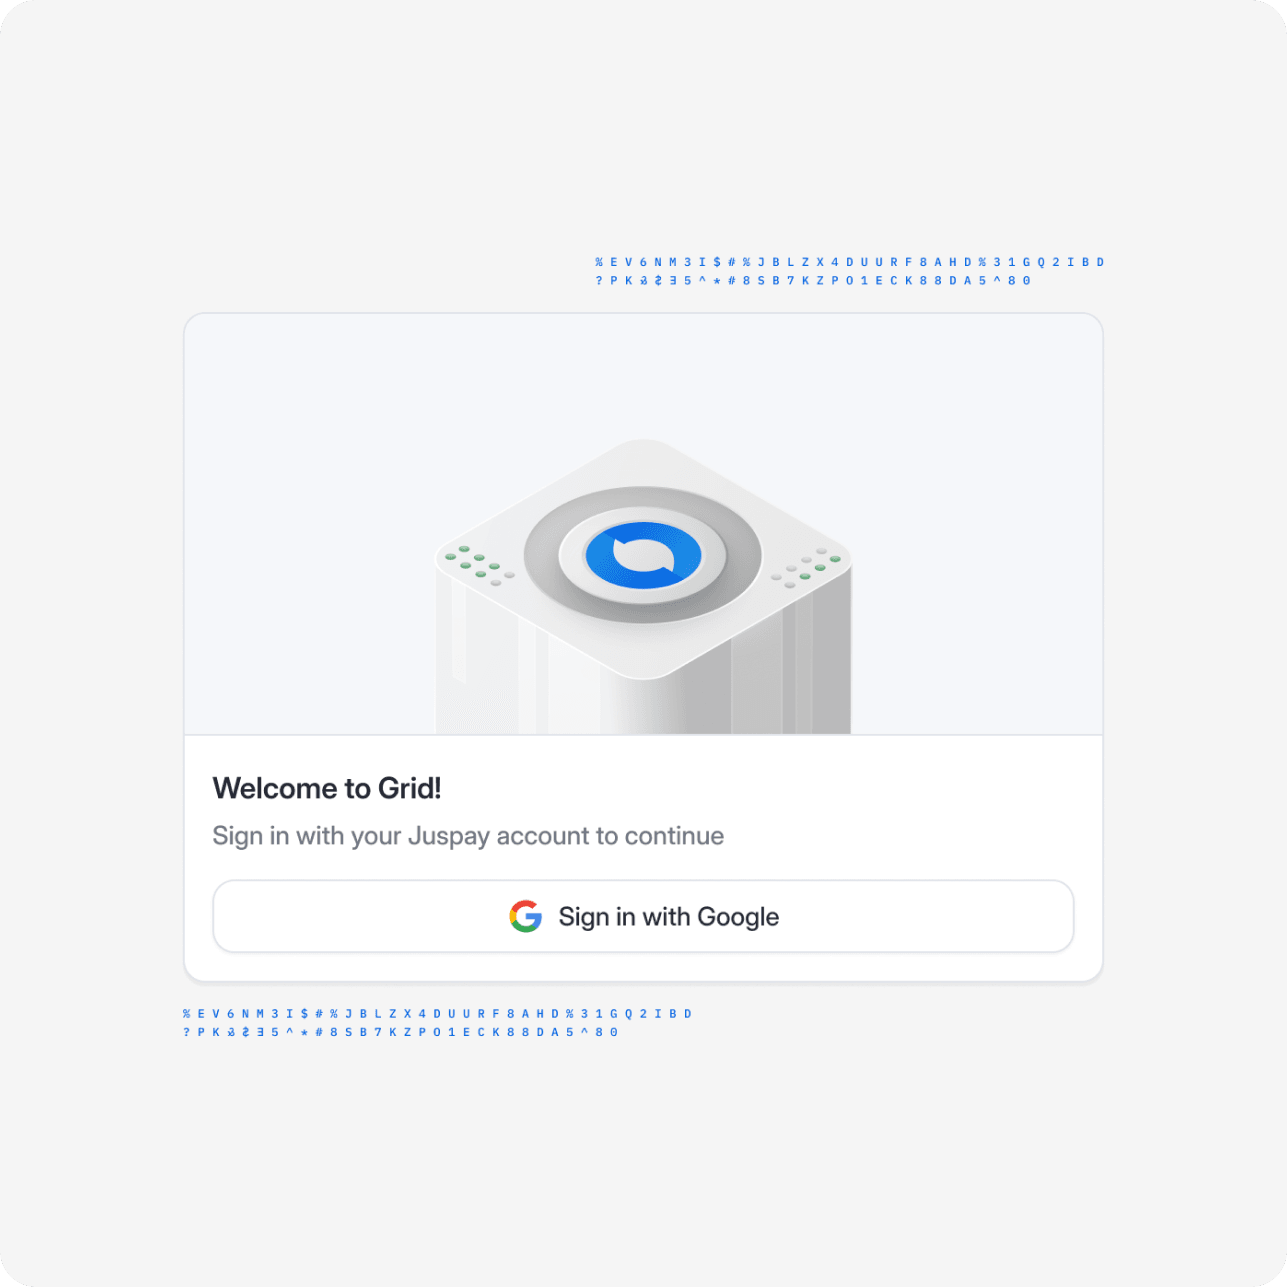
Login Page
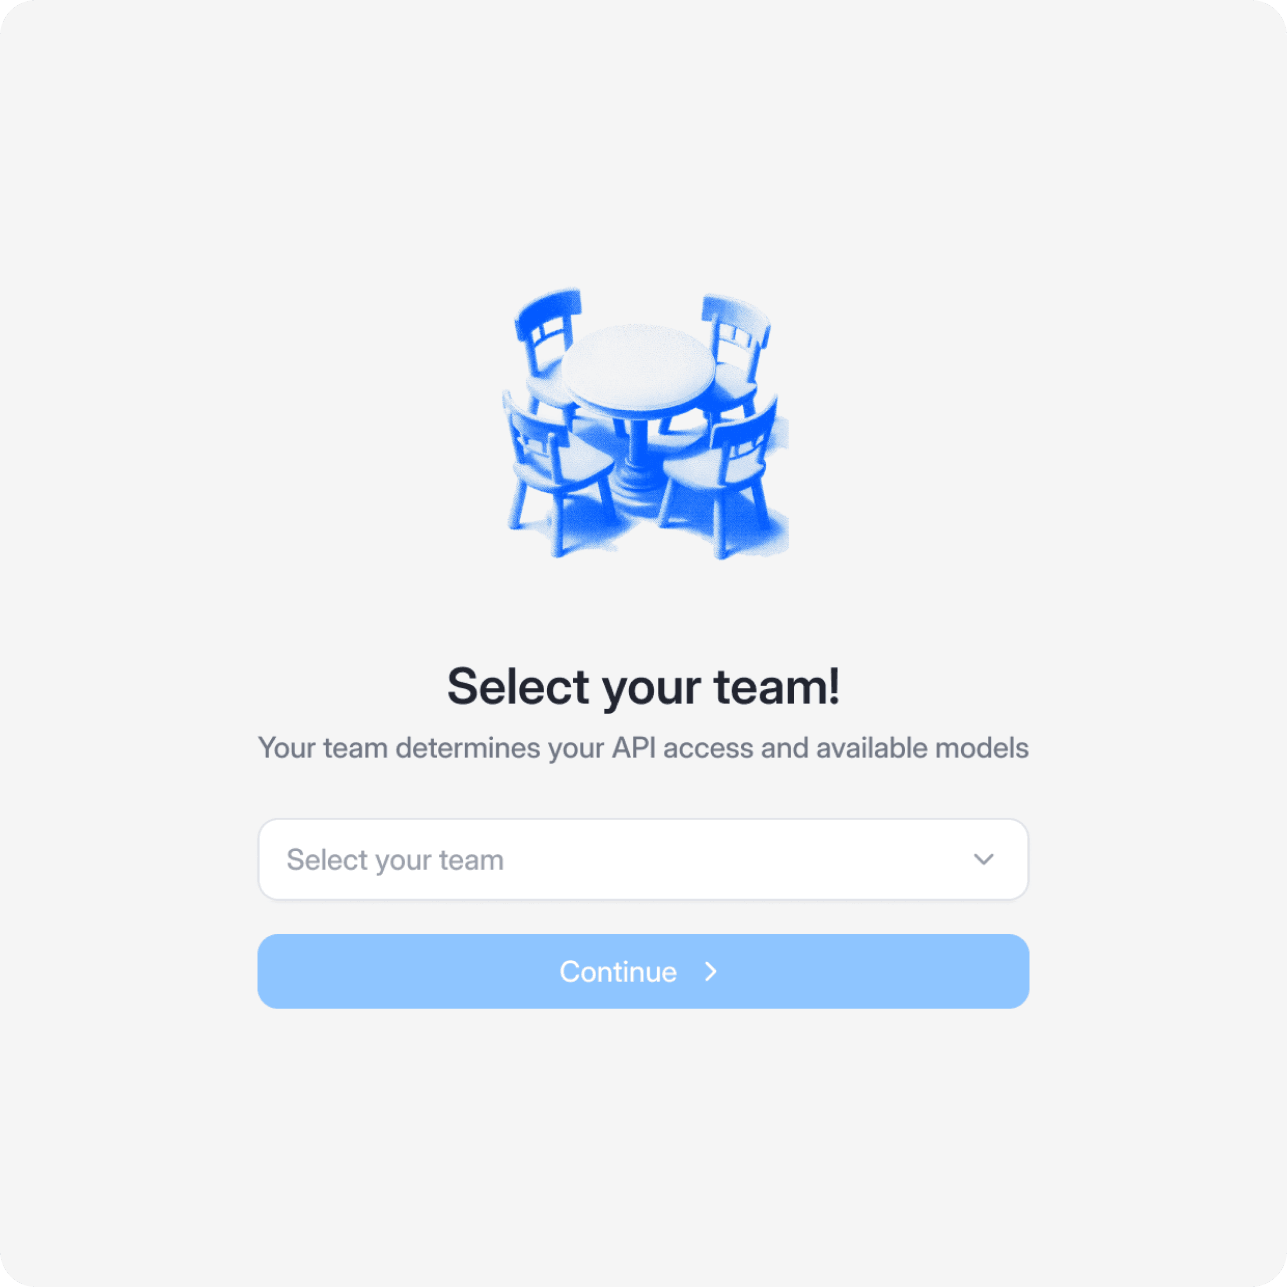
Onboarding and Team Selection
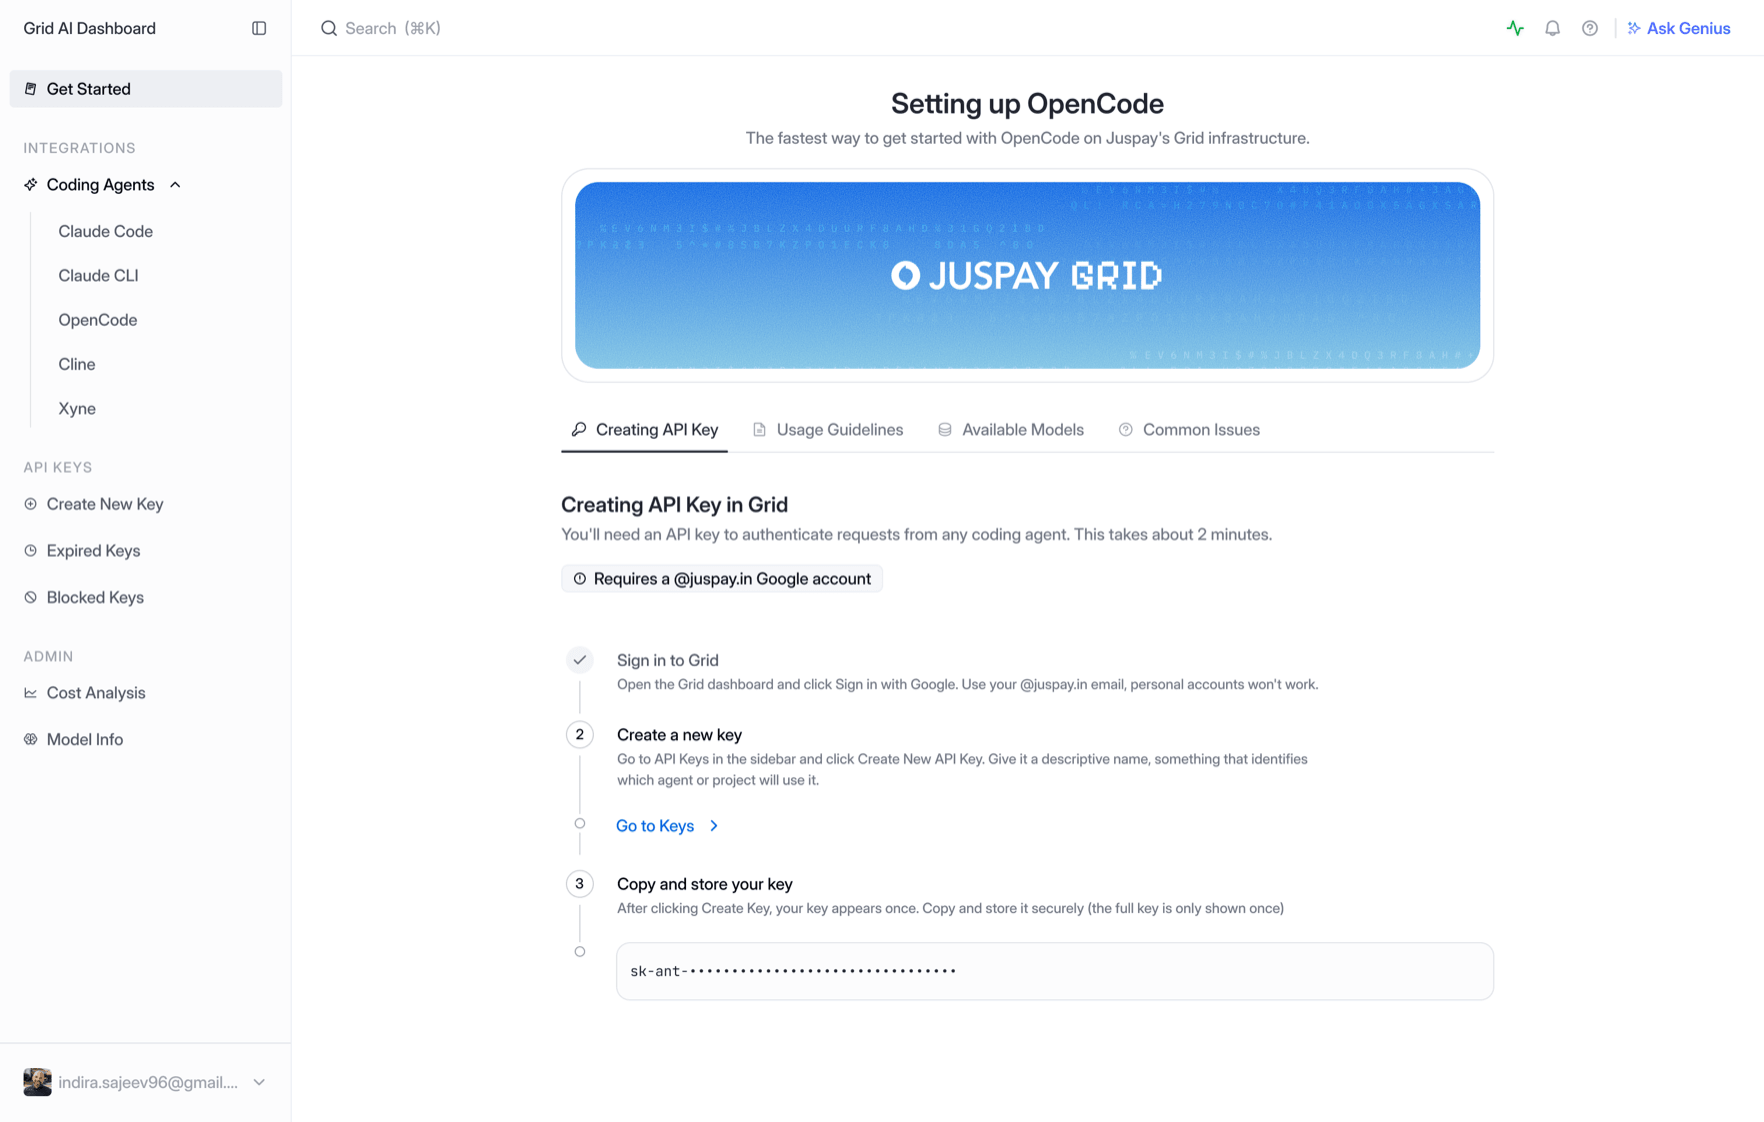
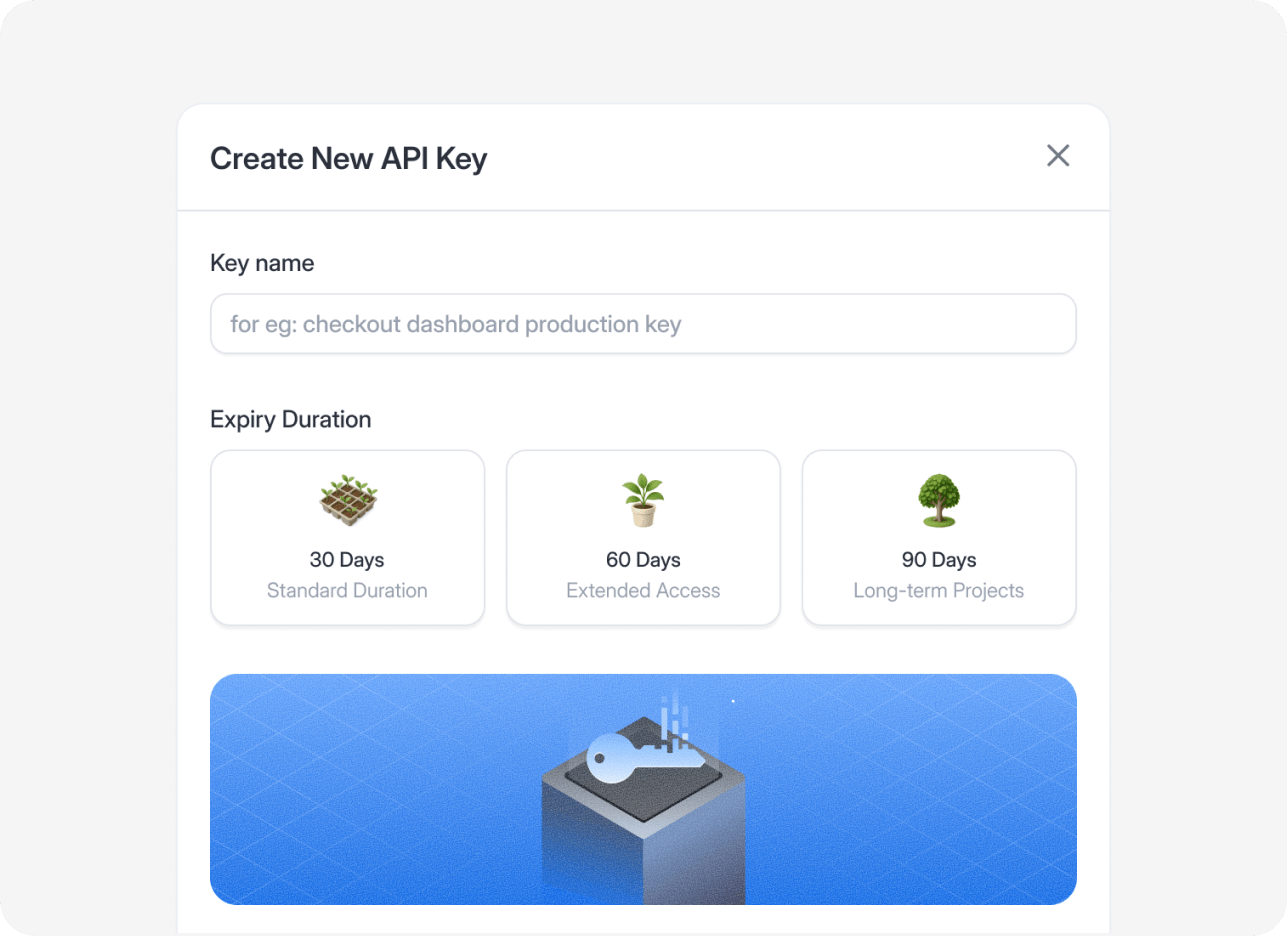
Creating API Keys

Visual Explorations for the GPU Pulse Page
For admins
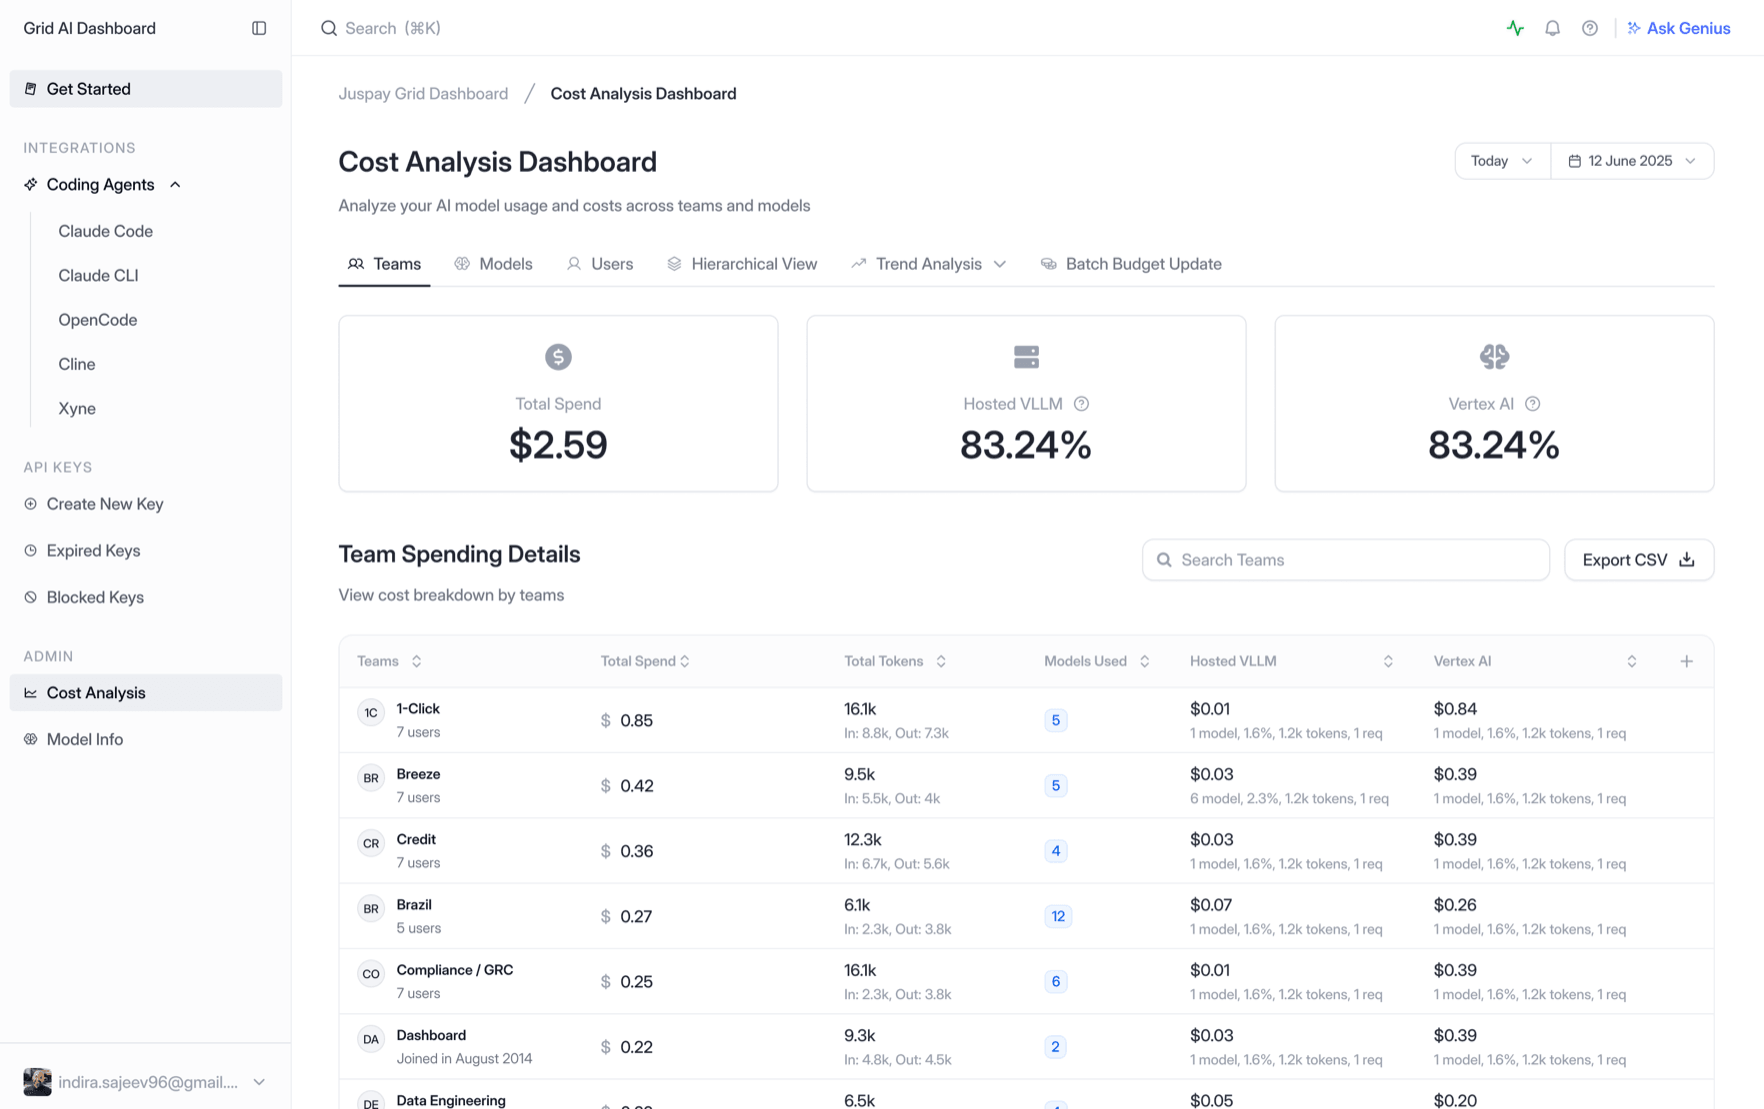
One view that reconciles Vertex, self-hosted GPU, and SaaS spend into a single trustworthy figure, checked against GCP billing so people stop doubting it - with the GPU story finally attached: utilization, off-peak idle, hours versus wastage. Moved aggregation into the database and cached it every six hours. The 5-15 second wait became sub-two-second.
Internal tools get treated like plumbing
The dashboard doesn't need to be boring. Nobody's watching, so nobody bothers - you get grey tables, default components, and the unspoken assumption that if it works, looks don't matter.
Grid serves 500 engineers every day. That's not a reason to care less about how it looks. It's the reason to care more.
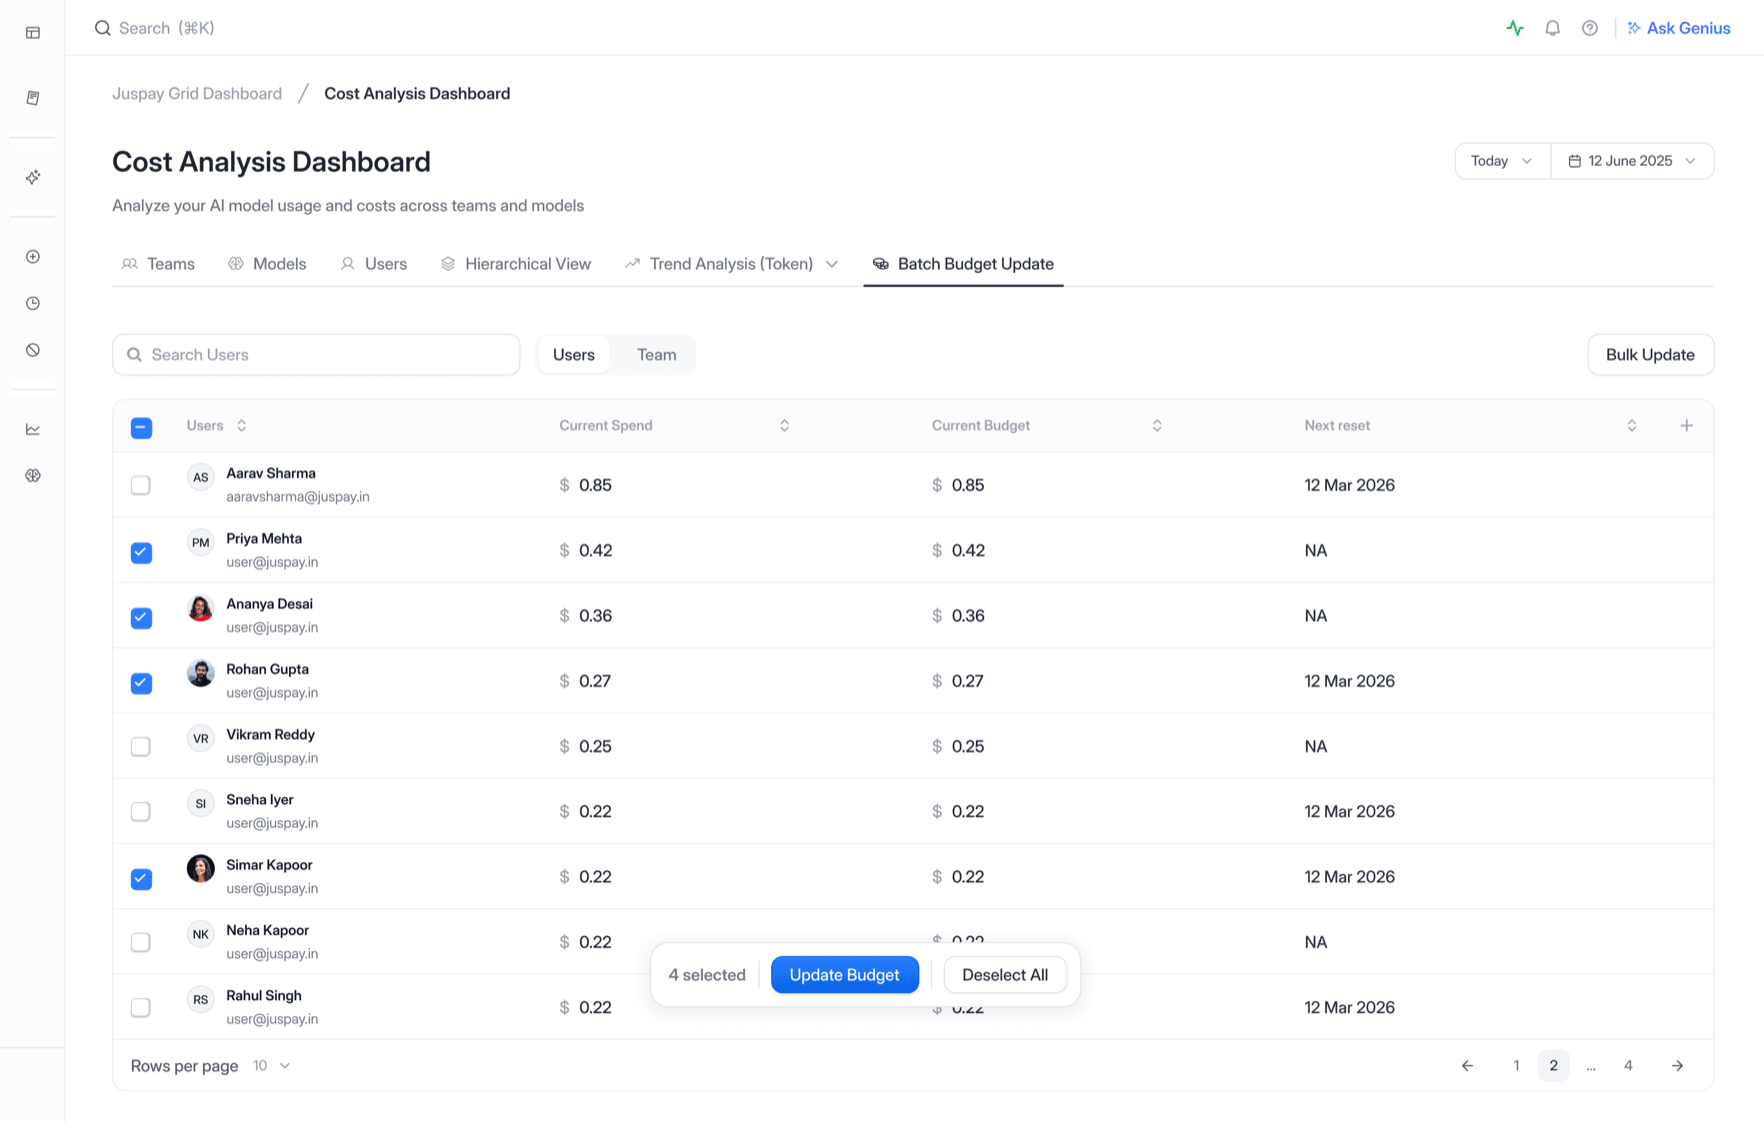
So I designed it like it was going in front of customers. A real visual system, not stock dashboard parts: the gauges, heat cells, status chips, and dense tables you've been scrolling past are all deliberate, all built to a consistent language. Craft and clarity aren't a trade-off. The tables load in under two seconds and they look like someone gave a damn.